Common Types of Maps
A map is a symbolic representation of selected characteristics of a place, usually drawn on a flat surface. Mapmakers, called cartographers, create maps for many different purposes.
Maps present information about the world in a simple, visual way. They teach about the world by showing sizes and shapes of countries, locations of features, and distances between places. Maps can show distributions of things over Earth, such as settlement patterns.
Maps present information about the world in a simple, visual way. They teach about the world by showing sizes and shapes of countries, locations of features, and distances between places. Maps can show distributions of things over Earth, such as settlement patterns.
Political Map
|
Political Maps show the geographic boundaries between governmental units such as countries, states, and counties.
These boundaries are man-made divisions of land. They may also show features such as:
|
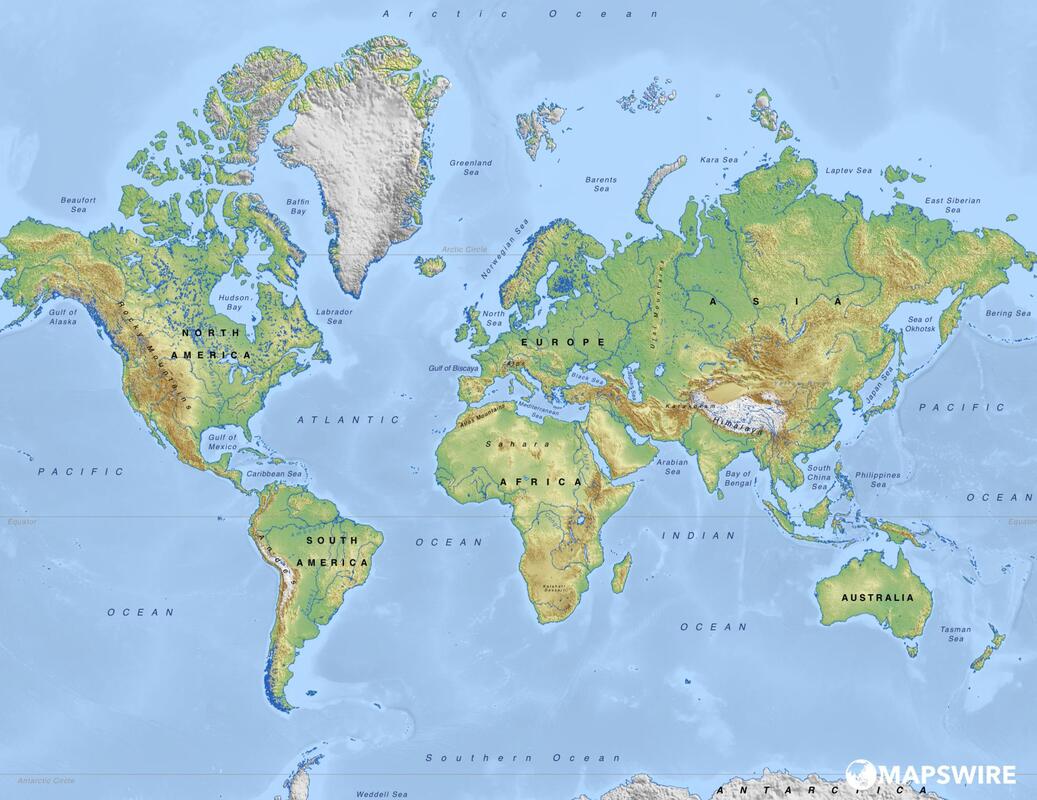
Physical Map
|
Physical Maps show the natural landscape features of Earth.
They may also include labels for features such as mountain ranges and bodies of water. Physical maps often have a green to brown to grey color scheme for showing the elevation of the land:
|
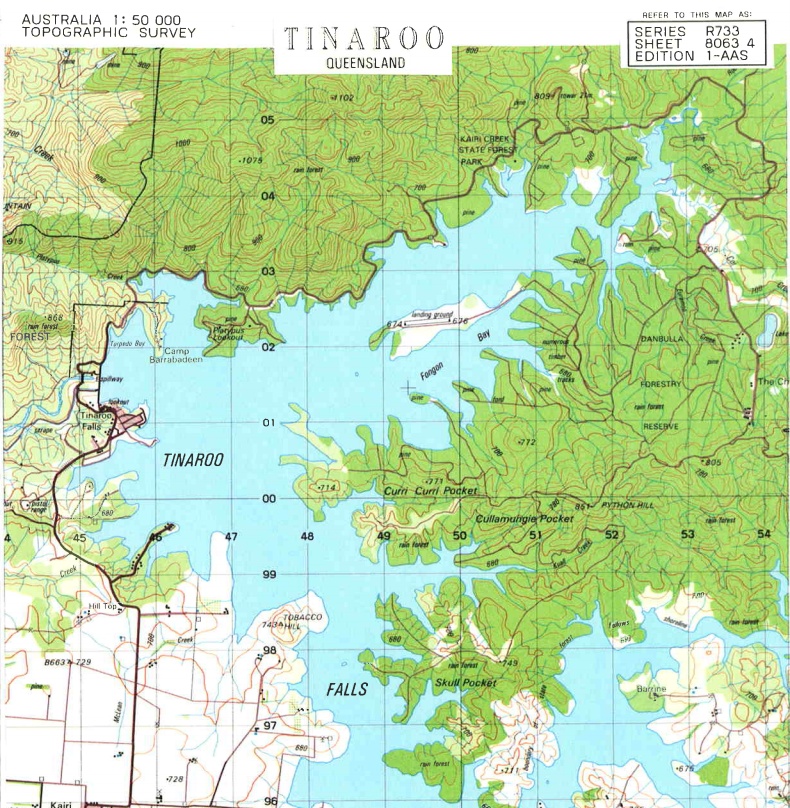
Topographic Map
|
Topographic Maps show the features of the land, mainly the shape of Earth’s surface and changes in elevation.
They usually do this with lines of equal elevation known as "contour lines", but elevation can also be shown using colours, colour gradients, shaded relief and a number of other methods. Topographic maps also show other important natural features such as lakes, rivers and streams. Their locations are determined by topography, making them important natural elements of topographic maps. Important cultural features (made by people) are also shown on topographic maps. These include roads, trails, buildings, place names, bench marks, cemeteries, churches, schools and much more. A standardized set of special symbols has been developed for this use. Topographic maps are frequently used by hunters, hikers, skiers, and others seeking outdoor recreation. They are also essential tools of the trade for geologists, surveyors, engineers, construction workers, landscape planners, architects, biologists and many other professions - especially people in the military. |
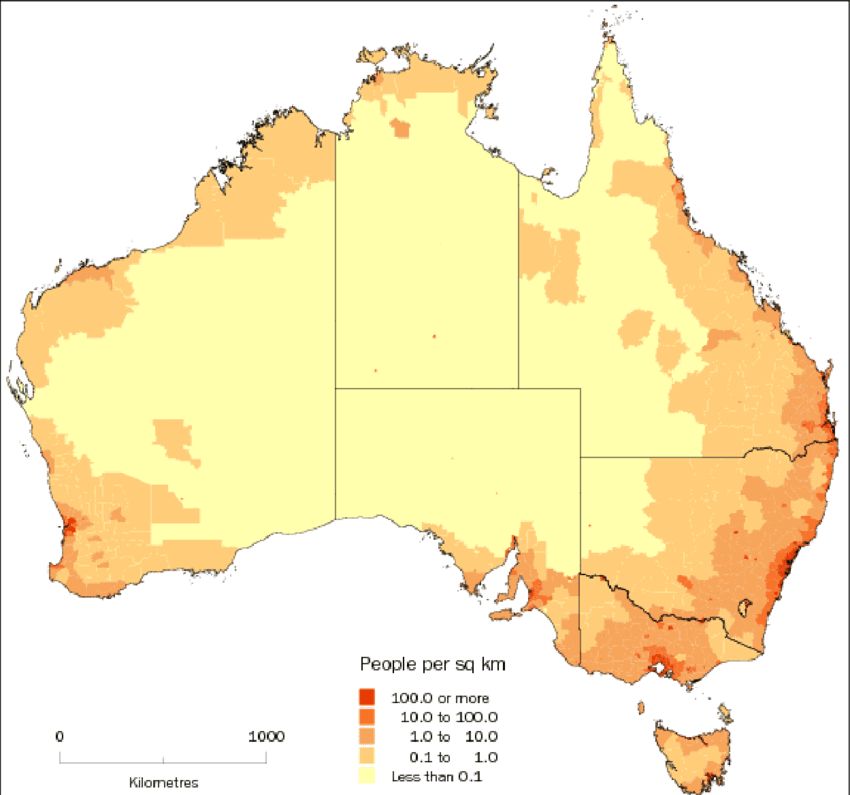
Thematic Maps
|
Thematic Maps display distributions, or patterns, over Earth’s surface.
They emphasize one theme, or topic. These themes can include information about people, other organisms, or the land. Examples include crop production, people’s average income, where different languages are spoken, or average annual rainfall. |
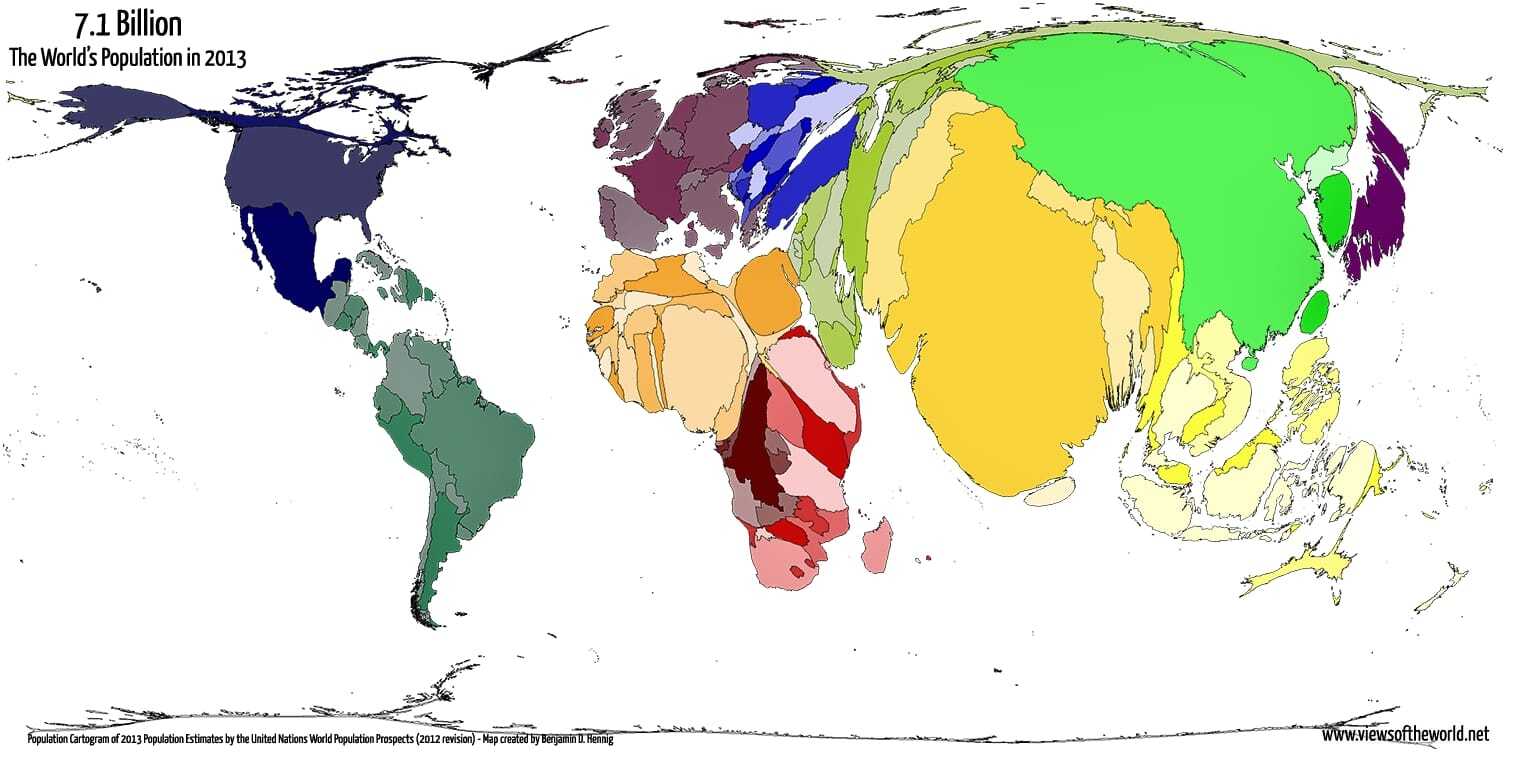
Cartogram
|
A Cartogram (also called a value-area map) is a thematic map.
It is a map that is based on the scale of the measurement of a variable, not the true scale of the area. The geometry of regions are distorted in order to convey the information. The region area will be inflated or deflated according to its numeric value. Certain cartographic rules apply in that, as far as possible, position and shapes of countries, provinces and states are conserved, but they are stylised, resized or distorted. E.g. the size of countries on a map might be drawn proportional to their populations. |
Choropleth Map
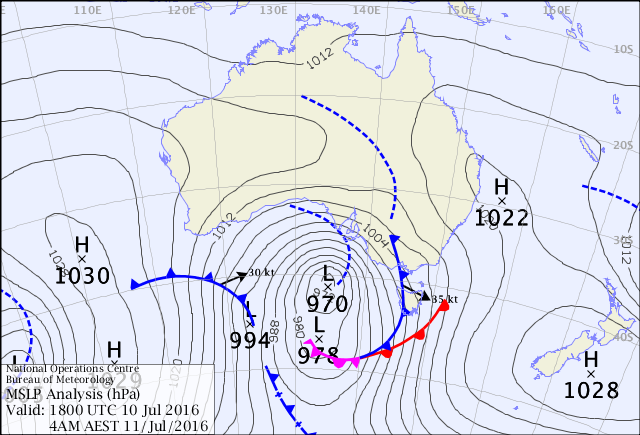
Synoptic Charts
|
Synoptic charts show the distribution of meteorological conditions over a wide region at a given moment. They are used to show predicted temperatures, predicted precipitation, storm warnings of various kinds, wind speed and direction, chance of precipitation, type of precipitation, snow accumulation, frost prediction and many other aspects of weather.
All of these synoptic charts are continuously updated to communicate the most current information. |
Isoline Map

|
Isolines are lines drawn on maps connecting data points of the same value.
Isolines should have equal intervals between them numerically, and if shaded in a choropleth manner, the map can be known as an isopleth map. |
Sources:
Geology.com. Types of Maps. https://geology.com/maps/types-of-maps/
National Geographic. Map. https://www.nationalgeographic.org/encyclopedia/map/
Geology.com. Types of Maps. https://geology.com/maps/types-of-maps/
National Geographic. Map. https://www.nationalgeographic.org/encyclopedia/map/
