What is the Methodology?
The methodology section of a report details:
- how the research was conducted
- the research methods used
- the reasons for choosing those methods
Data Reports
Outline the main sources (websites, books etc) used to gather data and information used in your data report.
You don't have to outline every single source used, but if you got a majority of your data or information from a few key websites, state what they are and provide some details and context about them.
You don't have to outline every single source used, but if you got a majority of your data or information from a few key websites, state what they are and provide some details and context about them.
Examples:
- “Data was sourced primarily from the Australian Bureau of Statistics Census for the years 2001 and 2016 to enable a study of trends over the 15 year period.”
- "The report uses data and information obtained from a variety of sources, including Our World in Data, Statista and the Central Intelligence Agency (CIA)"
- "Data and information was primarily gathered from the websites of independent agencies of the U.S. federal government such as the National Aeronautics and Space Administration (NASA) and the National Oceanic and Atmospheric Administration (NOAA)."
Field Reports
Include specific details about the field trip - the what, how, when and where. E.g. the time of year, time of day, area or locations visited.
Discuss field research methods. In other words, explain in detail how field research was carried out.
Discuss field research methods. In other words, explain in detail how field research was carried out.
Examples:
- “Fieldwork was undertaken to collect primary data in order to measure…”
- "Fieldwork was conducted in the form of ... to find evidence of ..."
Field research methods
Figures
Include figures to support your methodology, such as:
Include figures to support your methodology, such as:
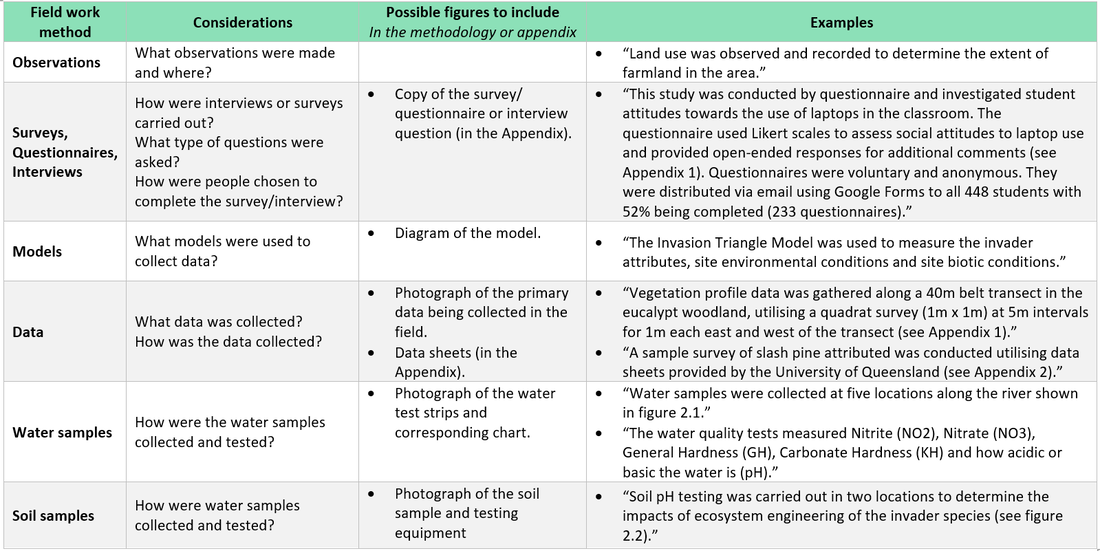
- Diagrams of the models used e.g. Invasion Triangle model
- Photographs of the tools used e.g. Water quality tests
- Photographs of data being gathered e.g. The quadrat sample set up over the vegetation
- Maps showing locations visited or where tests were undertaken
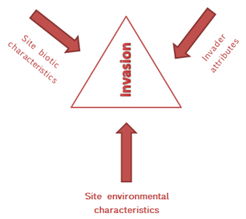
Figure 2.1 The Invasion Triangle model
|
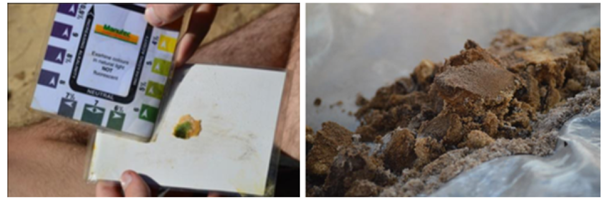
Figure 2.2 Testing soil pH in the eucalypt woodland
|
Examples - Secondary data obtained for the field report
- “Secondary data and information was used for rainfall, groundwater and management strategies.”
- “Secondary information about the management of the basin was collected from websites such as the Murray-Darling Basin Authority (Australian Government); the Department of Environment, Land, Water and Planning (Victorian Government); and the Department of Environment and Water (Government of South Australia).”
Limitations (2.1 Limitations)
Acknowledge the specific limitations of the data and information collected and used in your report.
- You can include a subheading for the limitations e.g. ‘2.1 Limitations’.
- Try to think of more than one limitation.
- Be specific about what potential limitations there are to your research and findings
Examples – Primary research
- “Water samples were collected from the banks of the river, not the middle of the water source which may affect the results of the tests.”
- “Water quality tests may be unreliable as it is difficult to interpret the colour of the strips with the scale on the box.”
- “Due to time constraints on the day, all of the samples could not be taken in one day. Specifically sample 1 was collected two days later which means that all results are not indicative of the conditions on one particular day.”
- “Conditions at locations vary daily so the results only represent a snapshot in time.”
- “Traffic data was recorded during school hours and not at peak travel times in the morning and afternoon where the challenge of traffic congestion is likely to be worse.”
Examples - Secondary research
- "Most of the data found only showed trends up to the years between 2016 and 2019, so the data is about 3-5 years old."
- "Census data may be unreliable in countries where there are low literacy rates and a high proportion of people living in rural and remote areas."
- "It is unclear how the ethics report on the dairy industry was funded, which may affect the validity of the information in the report."
- "Although Government websites were used where possible, these departments rely on government funding to exist which may affect the validity of some of the findings in the report about environmental quality."
