Population Pyramids
What is a Population Pyramid?
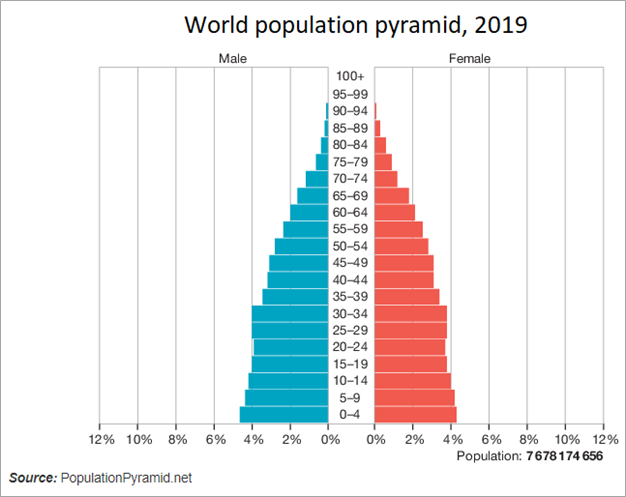
A population pyramid is a type of graph that is used to illustrate a population’s age and sex structure. It is also called an age-sex pyramid.
Population Pyramids are based on natural change (births-deaths) only – it does not include the effects of migration.
A population pyramid is a simple graph that conveys the complex social narrative of a population through its shape. Examining the population in a single year can allow us to:
Population Pyramids are based on natural change (births-deaths) only – it does not include the effects of migration.
A population pyramid is a simple graph that conveys the complex social narrative of a population through its shape. Examining the population in a single year can allow us to:
- see what stage the country is in
- see a record of its past
- predict future population trends
- make predictions about the types of services that population will need e.g. schools, aged-care homes.
|
|
Interpreting Population Pyramids
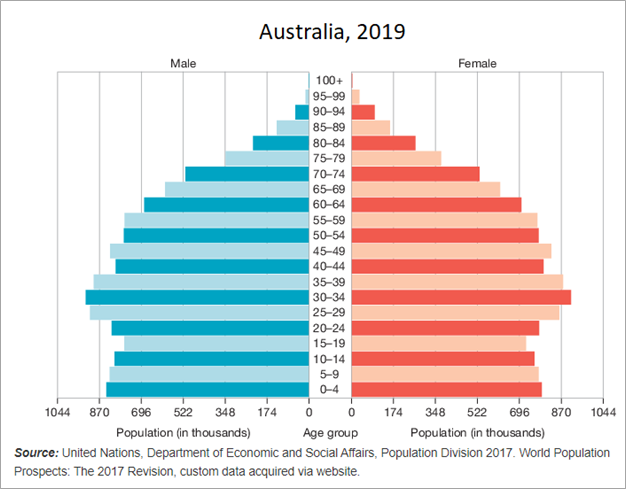
Population pyramids show the structure of a population by comparing relative numbers of people in different age groups called 'age cohorts'.

|
Population Pyramids: Powerful Predictors of the Future
By Kim Preshoff and TED-Ed [5:01] Description: Population statistics are like crystal balls - when examined closely, they can help predict a country's future (and give important clues about the past). Kim Preshoff explains how using a visual tool called a population pyramid helps policymakers and social scientists make sense of the statistics, using three different countries' pyramids as examples. |
|
Population Groupings
Reproductive years
These groupings are used to predict future populations:
The age divisions between reproductive groupings are not hardline rules. Girls 14 years old and younger, and women over the age of 45, can and do bear children. And some women between the ages of 15 and 44 years old are not able to bear children. These groupings are based on averages of the ages at which most females are at the height of their fertility.
These groupings are used to predict future populations:
- 0-14 years: Pre-reproductive years
- 15-49* years: Reproductive years
- 50+ years: Post-reproductive years
The age divisions between reproductive groupings are not hardline rules. Girls 14 years old and younger, and women over the age of 45, can and do bear children. And some women between the ages of 15 and 44 years old are not able to bear children. These groupings are based on averages of the ages at which most females are at the height of their fertility.
Working-age and dependents
|
|
Population Growth Categories
The demographic characteristics of countries can be divided into three broad categories:
- Expansive (young and growing)
- Stationary (little or no population growth)
- Contractive or constrictive (elderly and shrinking)
Stages
Note: The numbers 15 and 65 on each pyramid refer to ages. They separate the pyramid into:
- elderly dependents (65 years and over) - orange
- working-age population (15-64 years) - royal blue
- young dependents (0-14 year olds) - light blue
Stage 1: High Stationary

|
Applied to most of the world before the Industrial Revolution.
Both birth rates and death rates are high. As a result, population size remains fairly constant but can have major swings with events such as wars or pandemics. 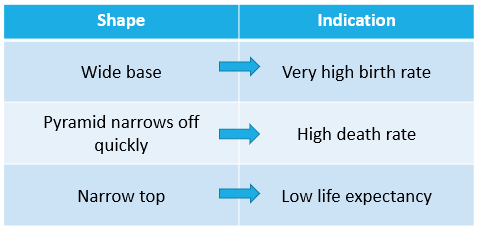
|
Stage 2: Early Expanding

|
The introduction of modern medicine lowers death rates, especially among children, while birth rates remain high; the result is rapid population growth.
Many of the least developed countries today are in Stage 2. 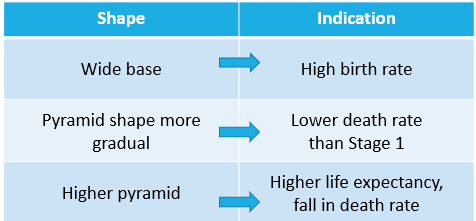
|
Stage 3: Late Expanding
|
Birth rates gradually decrease, usually as a result of improved economic conditions, an increase in women’s status, and access to contraception.
Population growth continues, but at a lower rate. Most developing countries are in Stage 3. 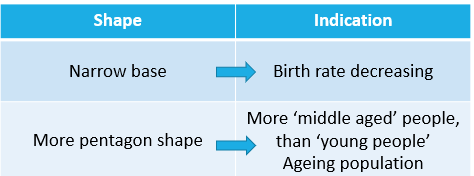
|
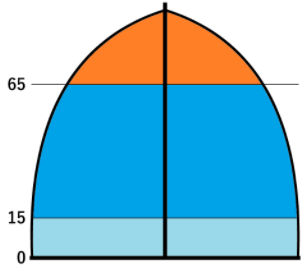
Stage 4: Low Stationary
|
Birth and death rates are both low, stabilising the population.
These countries tend to have stronger economies, higher levels of education, better healthcare, a higher proportion of working women, and a fertility rate hovering around two children per woman (replacement rate is 2.1) Most developed countries are in Stage 4. 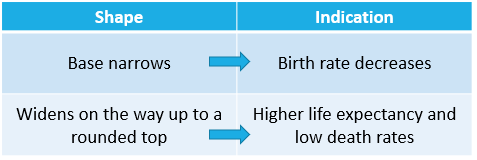
|
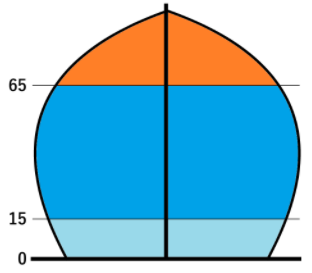
Stage 5: Contracting (aka declining)

|
Would include countries in which fertility rates have fallen significantly below replacement level (2.1 children)
The elderly population is greater than the youthful population resulting in an ageing population.
|
Demographic Transition Model (DTM)
Each of the 5 stages below in the Demographic Transition Model correspond with the stages of the population pyramid shapes shown above.

Country Examples
Note: On the x axis which shows population size, the numbers will change depending on the country's population size
e.g. Syria has intervals of 500,000 people, while China has intervals of 20 million people.
e.g. Syria has intervals of 500,000 people, while China has intervals of 20 million people.
Source: Countries - The World Factbook (cia.gov) > Country > People and Society > Population Pyramid
Population Pyramid Simulators
|
Population Pyramid Simulator
By the INED (Institut National d’Etudes Démographiques) Click on ‘Free Simulation’ > ‘Start Simulation’ |
