Referring to Figures in Reports
- You must refer to all figures that you include in your report to show its relevance.
- The figure should be underneath or next to the paragraph of information where you refer to it.
- In reports, you should elaborate on the data and information represented in the figure to make meaning of it and explain its relevance to your investigation.
Examples
|
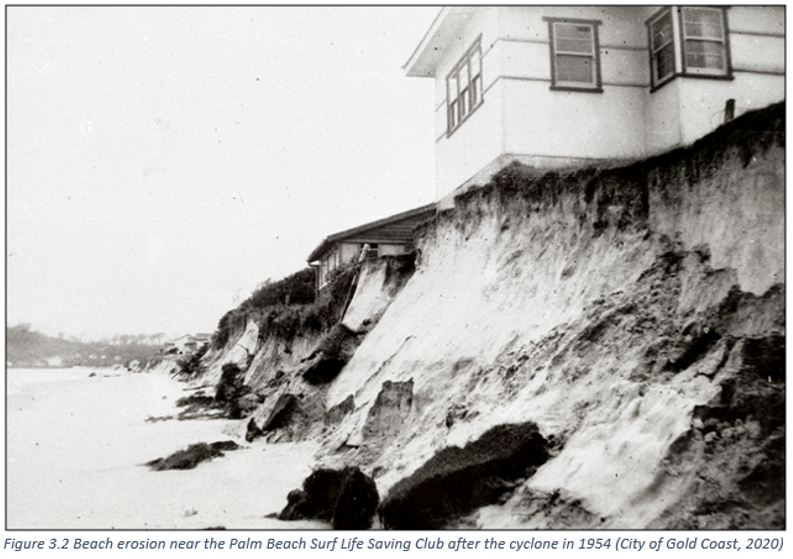
The Gold Coast is prone to storms and tropical cyclones which can have devastating impacts. The ‘Great Gold Coast Cyclone’ during February 1954 resulted in 30 deaths when it crossed the coast as a Category Two system (MyGC, 2020). In addition to claiming lives, the strong winds and heavy rainfall caused severe beach erosion and serious structural damage to numerous buildings (figure 3.2).
|
|
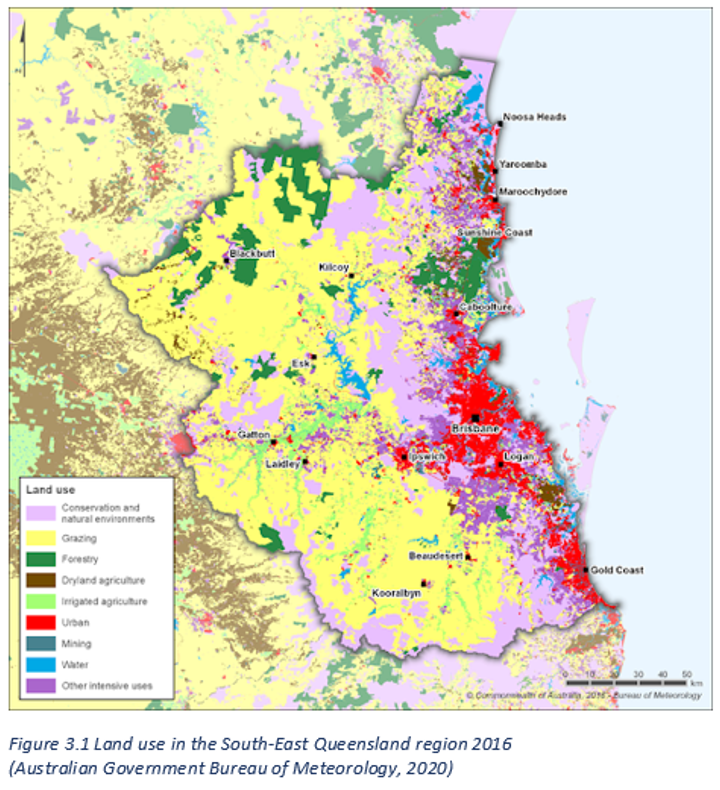
Figure 3.1 shows that the land closest to the coastline in the Gold Coast region is highly developed, with a majority of the land being classified as ‘urban’. West of the urban environment, the land is classified as ‘other intensive uses’ which also puts pressure on the biophysical environment of this region.
|
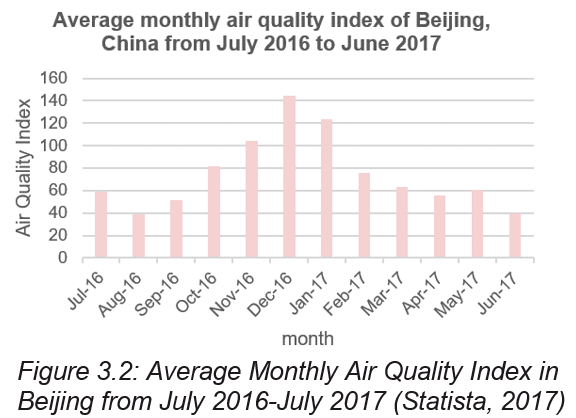
Figure 3.2 shows that between July 2016 and June 2017, the Air Quality Index was much higher in November, December and January, which are the colder months in China. The Air Quality Index recorded above 100 which is considered unhealthy for sensitive groups, such as children and the elderly. China’s main source of central heating is coal, meaning more is burnt during winter which results in poorer air quality (Airlief, 2018).
|
|
